DataFest 2025: Commercial Real Estate Trend Analysis
Project Overview
Title: Analyzing Post-Pandemic Commercial Real Estate Trends
Duration: 48-hour DataFest hackathon competition
Team: 3 members (Team Perspicacity)
Role: Lead Analyst and Visualization Designer
Achievement: Winner of “Best Visualization” award at ASA DataFest 2025
Challenge
Savills, an international commercial real estate firm, provided our team with a comprehensive dataset of commercial leasing transactions from 2018-2024. Our challenge was to identify actionable insights and market trends to help Savills advise clients on optimal office leasing strategies in the post-pandemic landscape.
Approach
- Data Preparation and Cleaning
- Consolidated multiple data sources including lease transactions, market occupancy data, and unemployment statistics
- Addressed missing values by focusing on transactions above 10,000 square feet in major markets
- Created consistent time period definitions to allow for pre-pandemic, pandemic, and post-pandemic comparisons
- Exploratory Data Analysis
- Analyzed transaction patterns by building class, industry sector, and transaction type
- Identified regional trends and market-specific developments
- Examined relationships between rent costs and availability proportions
- Visualization Development
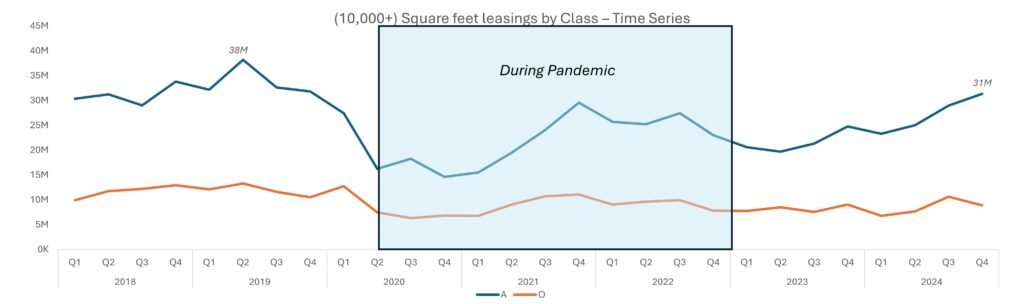
- Created interactive time series visualizations to track leasing trends by building class
- Designed comparative bar charts to contrast sector-specific leasing behaviors
- Developed matrix visualizations to highlight transaction type changes by region and sector
Key Findings
- Building Class Recovery Patterns
- Class A properties demonstrated significantly stronger post-pandemic recovery than Class O properties, with leasing volumes approaching pre-pandemic levels by Q4 2024
- Premium office spaces are in higher demand as companies implement return-to-office strategies
- Sector-Specific Insights
- Technology sector exhibited the most volatility but remained the largest leaseholder
- Financial services showed remarkable resilience with minimal change in overall leasing volume
- Legal sector maintained the most consistent leasing patterns across all time periods
- Regional Shifts
- Identified dramatic increases in legal and financial service relocations to Western regions (25x and 15x increases respectively)
- Discovered significant expansion in Midwestern markets across multiple sectors
- Documented substantial decreases in new leases within traditional CBDs (-68%)
- Occupancy Trends
- All major sectors followed nearly identical occupancy recovery patterns
- Building occupancy stabilized at approximately 50% of pre-pandemic levels by 2024
Impact and Results
Our analysis provided Savills with actionable intelligence to guide client recommendations by:
- Identifying which markets and submarkets showed the strongest recovery potential
- Highlighting sector-specific leasing strategies based on historical and current trends
- Quantifying the relationship between building class and leasing resilience
- Mapping emerging geographic preferences across different industry sectors
The judges specifically praised our visualization techniques for effectively communicating complex multi-dimensional data in an intuitive format that made clear recommendations possible.
Tools and Technologies
- Data Analysis: R (tidyverse, dplyr, tidycensus)
- Data Visualization: ggplot2, Tableau
- Presentation: React-based interactive dashboard
Skills Demonstrated
- Advanced data cleaning and transformation
- Multi-dimensional data analysis
- Geospatial trend identification
- Effective data visualization design
- Insight extraction from complex datasets
- Business intelligence development
- Client-focused presentation skills
Reflection
This project challenged our team to extract meaningful insights from an incomplete but rich dataset. The strict time constraints of the hackathon forced us to quickly identify the most promising avenues of investigation and develop effective visualization strategies that clearly communicated our findings.
The award validation confirmed that our approach of focusing on actionable, market-specific insights rather than broad generalizations was effective. I’m particularly proud of how we integrated multiple data sources to create a coherent narrative about the evolving commercial real estate landscape.
©️ Obinna Nweke, 2024.